Opportunity
Clinical Analytics Software uses opportunity calculations to show facilities and physicians areas where they can improve. Opportunity is used through Clinical Analytics, and in other Axiom Software products, as well. Opportunity is expressed in tables with red and green cells. If you have an opportunity to improve your performance compared to the benchmark, the cell is red. If your performance is already better than the benchmark, the cell is green.
- See Benchmark calculations for more information about how benchmark values are determined.
- See Charge and Cost Measure calculations for specific applications of Opportunity calculations.
Rounding
With all calculations in Clinical Analytics, keep in mind that displayed values are rounded to 2 decimal places while Clinical Analytics is running calculations in the background using several more decimal places. This may result in slight discrepancies between what you calculate from the values on your screen and the final rounded opportunity value you see.
Polarity
Low values are desirable for some measures, and high values are desirable for others. This is called polarity. The Measure Definitions section lists the polarity of each measure if you are unsure. Some measures, like gender and volume, have undeterminable polarity.
Average opportunity calculation
In most cases, we calculate opportunity by subtracting the benchmark value from the internal profile. Sometimes this results in a negative opportunity value, which is not a problem. Depending on the polarity of the measure, this may or may not be desirable.
The calculation for opportunity is: Internal profile value – Benchmark = Opportunity
This opportunity calculation is performed for every encounter in the profile, then the differences are summed over all the encounters to give the Total Opportunity. Total Opportunity divided by the number of encounters gives us Average Opportunity.
See Charge and Cost Measure calculations for a specific example of these calculations in the Charges and Costs Detail section.
ICU days example
Let’s look at Days-Critical Care / Intermediate ICU for an example.
- In the sample table below, the hospital’s 262 applicable patient encounters had a total of 691 days, for an average of 2.64 days per encounter.
- The average benchmark is 2.16 days per patient; this is the arithmetic average of the benchmark values across all 262 encounters in this profile.
- Each encounter's benchmark value is subtracted from the number of Critical Care/Intermediate ICU days for the encounter.
- These differences are summed over all 262 encounters, which gives us 126 Total Opportunity days; we interpret this to mean that our patients used about 126 more ICU/CCU days than similar patients in the peer group.
- 126 days divided by the 262 encounters equals .48 Average Opportunity days per encounter. We interpret this to mean that our patients were in the ICU/CCU about 12 hours more than similar patients from the peer group.
NOTE: The benchmark value is pulled at the DRG level, so each encounter is compared to the benchmark value for other patients with the same APR-DRG/SOI or MS-DRG classification.

Sum opportunity calculation
Some measures, such as the patient safety indicator (PSI) and hospital-acquired conditions (HACs) measures, have an ideal value of zero. See the Patient safety measures list for more information. In these cases, the benchmark value is irrelevant and there can be no green opportunities. If your facility or physician has a value other than zero, that value becomes the opportunity for improvement.
HAC example
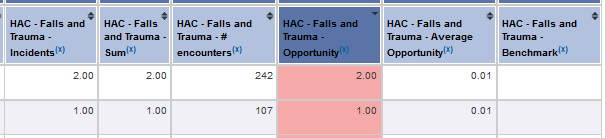
Let’s look at HAC- Falls and Trauma for an example. In the sample table below, the first physician saw two incidents of this HAC and the second physician saw one incident. Notice there is no Benchmark value because this is a "never-event," meaning this HAC should never occur. Thus, our physicians have opportunities of 2 and 1, respectively. When we divide the opportunity (2) by the number of encounters (242), we see the Average Opportunity is about .01, meaning that this HAC is happening to only about 1% of this physician's patients. We see similar average opportunity with the other physician (1/107).
Composite opportunity calculation
For measures with a composite (percentage or rate) value, the opportunity value estimates the number of deaths for the profile volume at the benchmark rate subtracted from the observed deaths.
NOTE: Opportunity = numerator - (benchmark * denominator)
Let's take a look at the mortality rate measure.
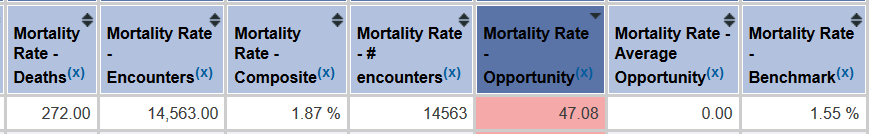
- Our facility saw 272 deaths out of 14,563 discharges for a mortality rate of 1.87%, compared to the benchmark rate of 1.55% (.0155).
- Total Opportunity = 272 deaths - (.0155 * 14563) = 46.27. We notice that this value is slightly smaller than the 47.08 Opportunity value in Clinical Analytics.
- Keep in mind that we used the rounded 1.55%, which can be magnified when multiplied by such a large number (14563). Clinical Analytics is calculating off of more decimal places in the background, so the 47.08 is more accurate than our calculation.
- We interpret this Opportunity value to mean that our facility saw approximately 47 more deaths than similar patients in the peer group population.
Measures without opportunity
Some measures do not have an opportunity, despite having valid benchmark and internal profile values. Measures like volume and gender are for keeping track of demographic information and are not used to drive hospital performance.
Gender example
Let’s look at Gender - Female for an example. In the sample table below, out of the 3541 total discharges from the facility for the year, 1935 were female. This was 54.65% of the encounters. Notice there are no benchmark or opportunity values for this measure.

